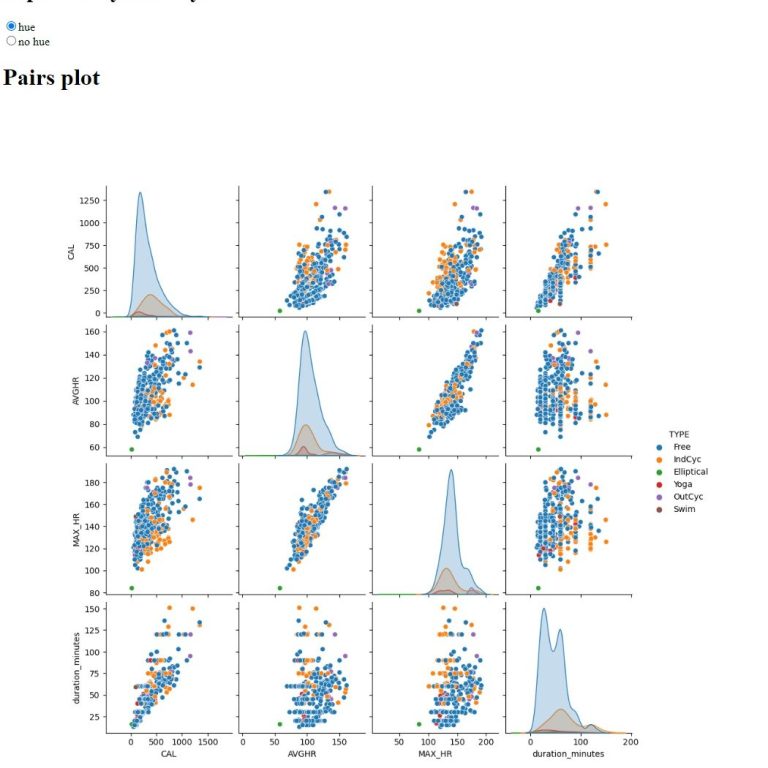
4 Pairs Plots - small date range vs full data set


These are 4 different pairs plot screenshots from a dashboard. The top row is using a small (constrained) time range and, therefore, doesn't have much data. The right column enables the "hue" parameter separates by activity by showing different colors for each.
Heart Rate Monitor data set analysis
4 fields in data. Calories burned, duration in minutes, average heart rate, maximum heart rate
Notice anything?
I see a few things...
I see correlation, skew, striation, bimodality and heteroscedasticity. How about you?
Does this solve the data?
No, it doesn't really work that way. Data isn't really something that can be solved. Instead, it's generally analyzed.
Data can be analyzed without understanding very much about the features. These are terms that I used before. It always helps to know a little something about the data. In this data, there are four categories as listed along the bottom of the graph:
Calories, Avg Heart Rate, Max Heart Rate, and Duration (minutes).
Let's zoom in

Pro tip: Pairs plots are triangular, meaning the same information is transmitted in the bottom left triangle as the top right. I usually look at the bottom left because I can see the category names better this way. I mentioned several things that I noticed in the data. Let's look at them individually...
Correlation?
I see correlation in lots of these graphs. Some have high correlation while others are lower. Here's an example of high correlation. This is MaxHR vs. AvgHR

Here's an example with lower correlation. Duration vs AvgHR:

The first graph, which has high correlation, means that the features predict each other well. High AvgHR generally means high MaxHR, and vice versa. However, in the 2nd graph, which has low correlation, knowing AvgHR doesn't give you much information about Duration, and of course vice versa.
Skew?
Skew means that the mean and the median have shifted away from each other. Left skewed data indicates mean is left of the median, while right skewed data means the mean is greater than the median. Here's an example of left skewed data. This is AvgHR vs. AvgHR, which is effectively a histogram.

Since the data is left skewed, mean AvgHR is lower than median AvgHR. This means that all things equal, shorter sessions were more common than longer sessions.
Striation?
Striation, or banding, is when unusual straight lines appear in the data. Here is duration vs Calories

Bands appear at 20, 30, 45, 60, 90 and 120 minutes!!
Here's another way of looking at it. This is the duration histogram:

What could this mean? It means that a disproportionate amount of sessions lasted these whole numbers, but it's hard to say more than that without knowing the context of the data.
This is a good example where data analysis meets subject expertise. A good data analyst would point out the striations, but couldn't tell you what they mean. However, knowing about the subject could give you an insight. Perhaps this athlete set out to practice for certain set intervals?
Could be!!!
Bimodality?
Bimodality inicates that there are two modes. Mode is the most common occurrence in the data. If a histogram is bimodal, then this means it has two peaks. The duration histogram has a bimodality.

What does the bimodality indicate?
It's hard to say... In this case, I believe that it's an artifact of the striation. Let's look at the same plot with the hue turned off...

Now we can see the same striation levels from before. But, we can also see that the bimodality observed above is an "artifact" and not an actual signal.
Heteroscedasticity?
Say that 5 times fast! Talk about a mouthful... So, what could that possibly mean? Don't worry, I had to look it up also. Hetero means different and "scedasticity" means skew. So, this means different skews. A funnel shape is an example you can see here in MaxHR vs. duration.

The skew increases with greater values. This means that the longer the duration is, the less predictive duration becomes predictive of MaxHR. For shorter sessions, there is less variation in max HR when compared with longer sessions.
We need your consent to load the translations
We use a third-party service to translate the website content that may collect data about your activity. Please review the details in the privacy policy and accept the service to view the translations.