Sensor comparison
We've gone in deep on sensors, especially tennis sensors. We have looked at 3 different ones! Let's review....
First we looked at the Zepp2. This is a butt-end sensor that measures Heaviness, ball speed, and spin. It also has XY data. This is the most sophisticated sensor and has continuous measurements for all 3 variables. The Zepp2 sensor was used for both matches and practice for many years, but is no longer functional.
Then, the Babolat Pop. This is wrist worn and measures style, speed, and effect. Style is a categorical variable. Has been worn for matches and practice.
Finally, the Zepp Universal in tennis mode. This sensor measures speed and spin in a similar fashion as the other two sensors, but measures x-y location instead of heaviness or style. This sensor also gives access to what appears to be the raw sensor values. This is not the case for the other two sensors. The is a butt-end sensor, but can only be worn in practice because of the sensor mount being less reliable.
Because the Pop sensor and either Zepp sensor can be used at the same time, it would be interesting to compare how each sensor measures the same session. From what is known about the sensors, the Pop sensor is less sensitive than the other two sensors, which seem relatively similar. However, the only strokes the Pop is thought to miss are weaker shots.
So, we have two different approaches. Compare Zepp2 to the Babolat Pop and compare the Zepp Universal sensor to the Pop.
We'll have to find some times when the sensors were used at the same time!

May 12, 2023
This date was chosen because it had a good varied sample set and seemed to have consistent data from both sensors.
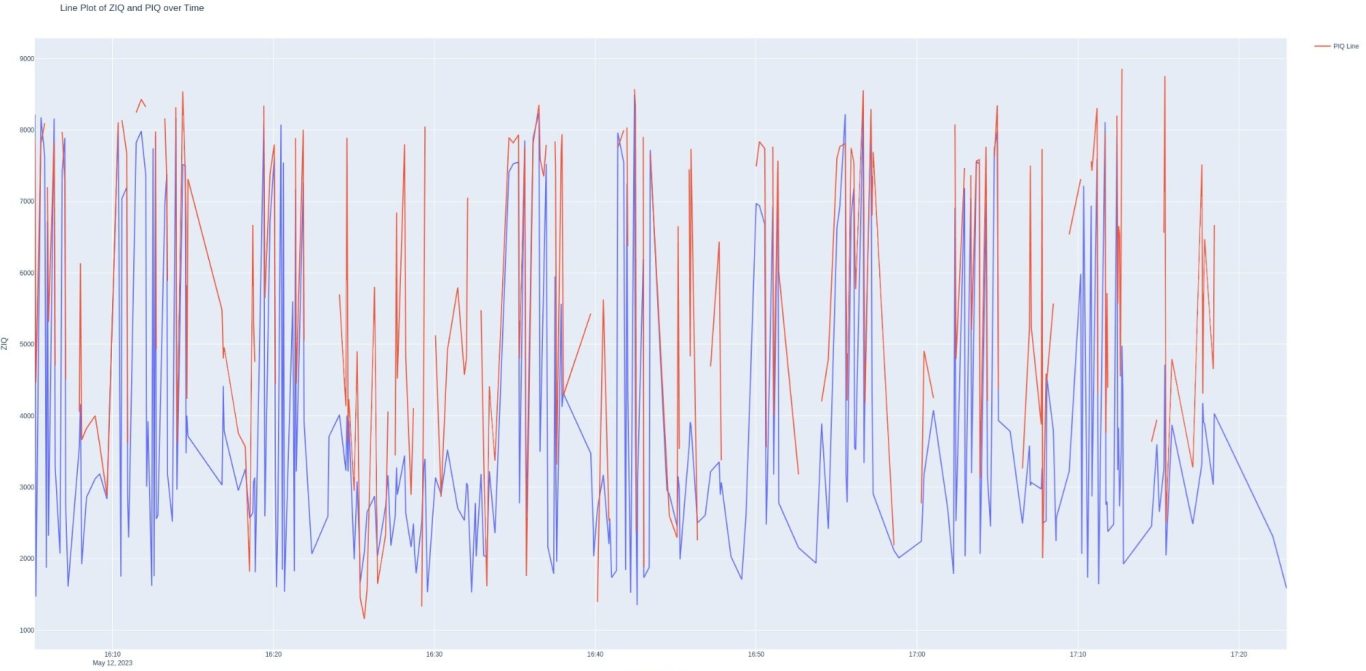
Here is a PIQ plot from the BabPop sensor for this day only.
Babolat Pop summary statistics

Zepp2 summary statistics

Why are they different?
Remember, the Babolat Pop performs a normalization calculation. This is why there is a value and score column for all 3 categories. Let's compare the ranges between the sensors:

This gives us a quick overview of how the sessions compare to each other. As was already mentioned, the Pop sensor seems less sensitive, especially for volleys, and so this might explain why 38 less shots are registered. The time stamps line up pretty well, so it looks like we are on the right path!
Maybe we can leverage the PIQ normalization scheme and provide our own score for the Zepp2? What should we call it? Maybe ZIQ?
It turns out thanks to ChatGPT-4o we can!

Kudos to GPT-4o! I tried this with version 4 and was getting nowhere fast!
Let's see how the new ZIQ columns look

interesting! It looks like the reference ranges line up, but the PIQ mean and the ZIQ mean are very different. Surely, this means there is a mistake!
Not necessarily! Remember, the ZIQ data has more shots included, and anecdotal data suggests that weaker shots are ignored by the Pop. Maybe this is weighing down the average?
ZIQ
We've used the system from the Pop sensor to create a reference from which we can create a new normalized column ZIQ. Now we can start to compare the two data sets... Let's see a ZIQ scatterplot:

ZIQ vs. PIQ
Since ZIQ and PIQ are now normalized can't we just plot them on the same graph?
We can! Thanks to this gem of a line from GPT-4o:
# Perform fuzzy join
merged_df = pd.merge_asof(dfz, dfb, left_on='HAPPENED_TIME', right_on='time', tolerance=tolerance, direction='nearest')

This is pretty good! These certainly show the same patterns are do indicate that the sensors are seeing similar things.
I think this warrants a further look at this. But, we still have the Zepp Universal Sensor to consider. Let's start with that before we circle back to this analysis...
May 25, 2024
This date was selected because there was a similar data set on this day. 350 shots from the Zepp Universal sensor and 340 from the Pop.
Let's follow the same steps as before:

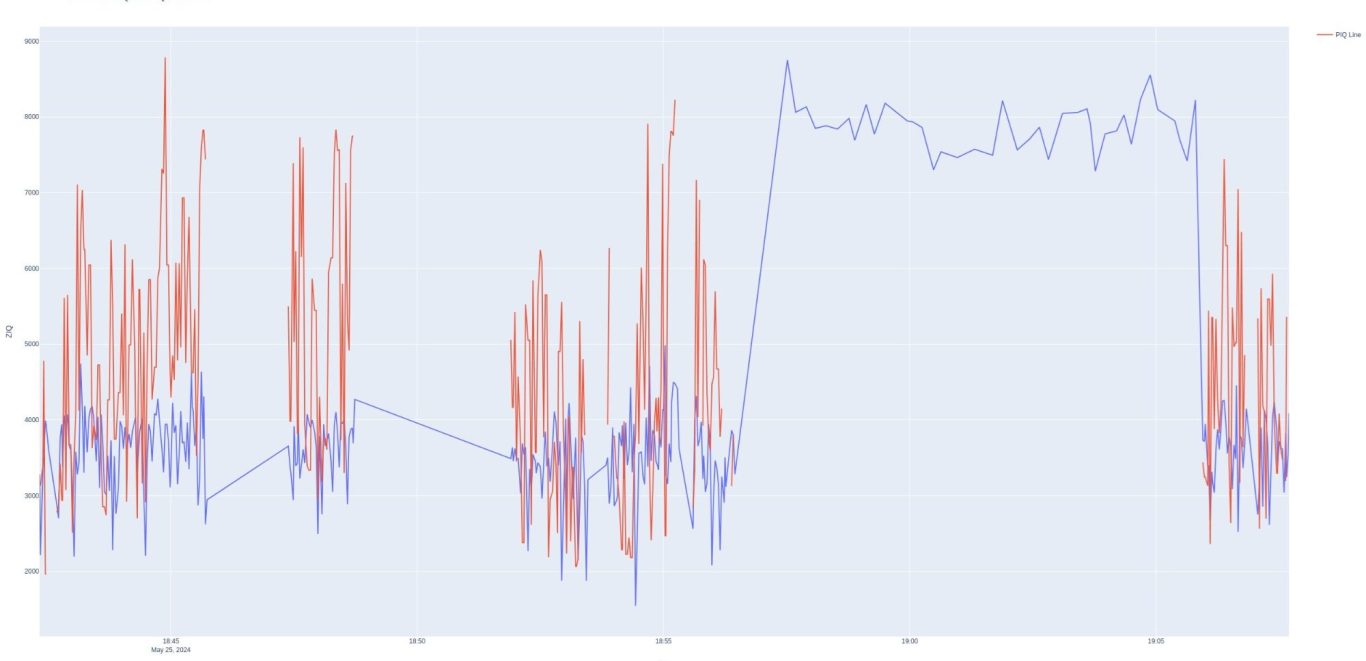
Did it work?
Kind of!
There's a few problems here, but it's not bad for a first look. The red curve is PIQ, so there is obviously a gap where several shots are missing. Also the PIQ scores are notably higher. Part of this is that the data is very different, as there is no style score. Instead, there are x,y impact location. This was my first attempt to deal with them, so we'll have to see how it holds up. But, there does seem to be a lot that matches up here. At least enough to continue along this path.
Clean up
We've got a promising start here, but the clearest problems are the missing shots, plus the level differences. If we remember way back to the Babolat Pop pairplot, there was a strange phenomenon with the serve plot where there was a strong linear divergence. This appears to penalize the serve to further normalize the data. This would make sense, since we've seen that serves are generally hit with the most power and spin.
Let's split up the PIQ and ZIQ values into their respective components. This is ZIQSpin

ZIQSpeed

ZIQStyle

We are starting to see both what is matching up and what remains a discrepancy.
Style, which probably would be thought of as the most difficult to match up with due to the discrete nature of the Pop data and the fact that the ZIQ equivalent is a penalty function based on impact locations x and y, was actually somewhat of a good fit.
However, spin matches up very little, and speed also doesn't seem to be a good match. It seems like we need to undertand the missing values though. There should only be 10 shots missing so this is a mystery. Let's look at just the PIQ and see what we can find...

This is only PIQ. In this case, we do see that the 'missing' values were serves and that they seem like they were not added to the merged data set. Here is the ZIQ data only:

Now we see for sure that the same pattern exists in both PIQ and ZIQ. There are a few bursts of forehands and backhands, then a period of serves, then a final burst of forehands/backhands, The ZIQ normalization has overrated the serves, probably due to a correction factor not being adjusted for serves.
Now we're having fun, right?
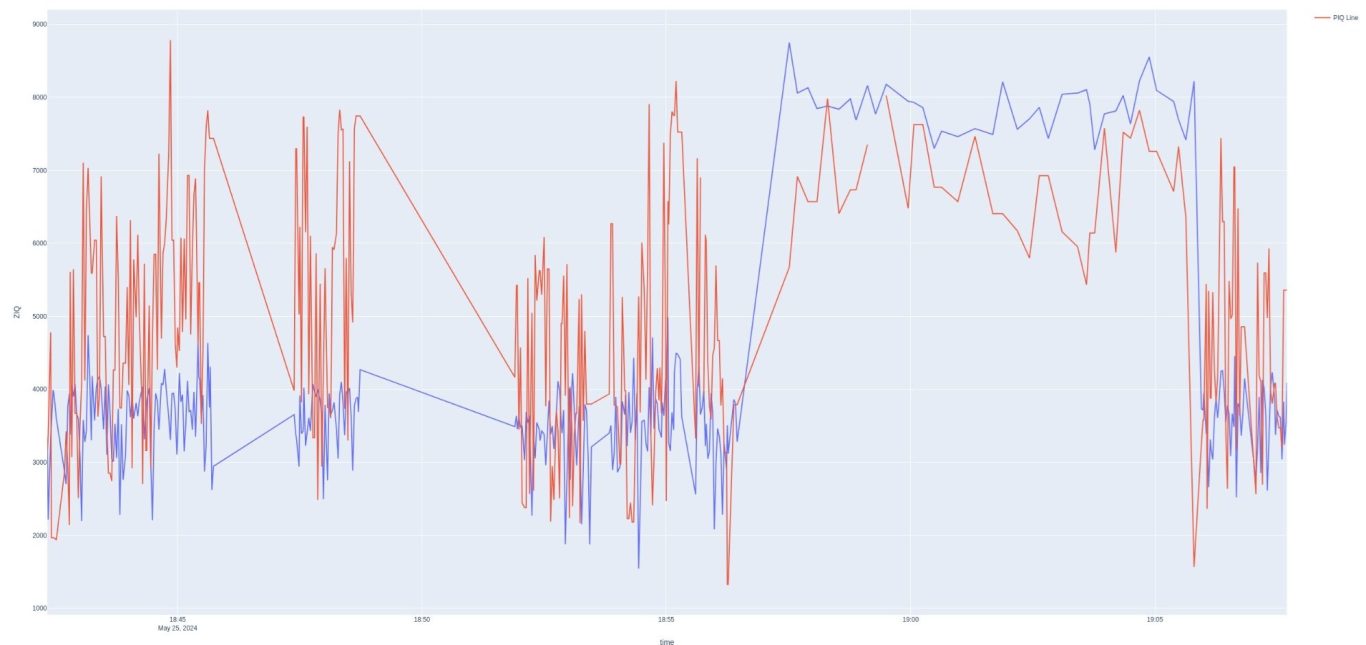
Maybe not, but this is the process. I inspected the PIQ/ZIQ data, especially for the serves and found that I needed a longer tolerance interval for the fuzzy matching. This pretty much matches up all the strokes. And, it shows the serves are aligned.

Let's see what we can do to normalize ZIQ to PIQ. After some trial and error I found that I could get a reasonable overlap by making multiplicative adjustments to the fields shown above. It's not perfect, and I'd be careful making too many judgments here, but this is certainly a promising start.

From what we see here, the Pop is the more sensitive sensor when it does pick up the shot. But, I think this is more a result of it being the standard to which we are comparing. Overall, it's pretty clear that the sensors are picking up the same events, so we at least have a path forward.
We need your consent to load the translations
We use a third-party service to translate the website content that may collect data about your activity. Please review the details in the privacy policy and accept the service to view the translations.