Stats fan?
Do you like data?
Then you should probably think about both statistics and data visualization.
Statistics - study of data tendencies using math
Data visualization - study of data tendencies using human eye
Do you think statistics is better than data visualization? Not necessarily!! Consider the normal distribution. The best test for normality is the human eye, not formulas!!

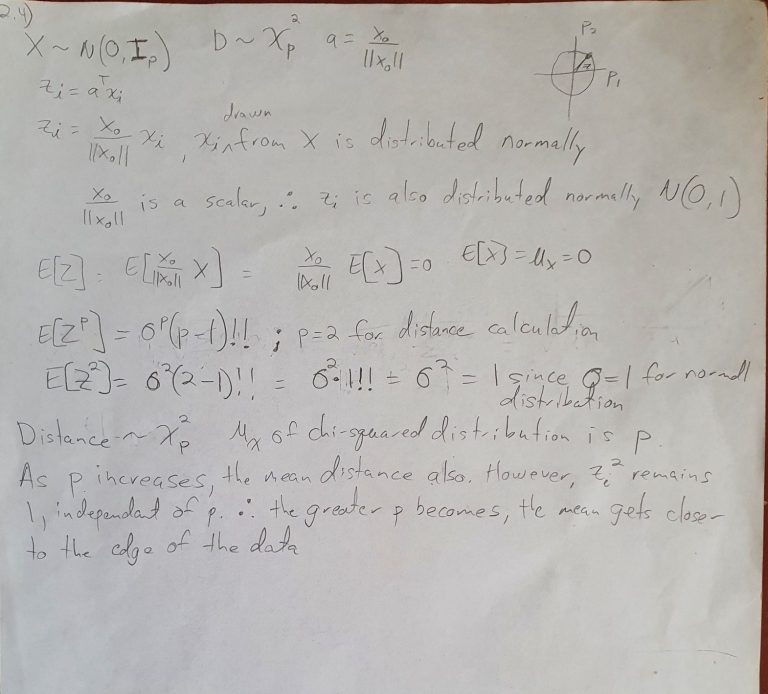
What is that chicken scratch?
That's math, friend!
Hate math? I get it, but how are we going to answer question 2.4 from Elements of Statistical Learning (EOSL?)

Gibberish?
Let's break it down
Why do you think EOSL would be asking such a question? I can't tell you for sure, but I can tell you that this is the "curse of high dimensions." This is a well known phenomenon in data analysis. When you add too many parameters to a model, the performance drops off rapidly. This forces you to add exponentially more data to get reasonable results. Don't believe me? Well, try to imagine a 3 dimensional histogram then. And that's just one additional dimension.
Have you ever wondered why? For me and many others, the only real answer is in the math.
Let's think about the question a little more... The curse is well described here. The average of the training points stay at 1 regardless of how many dimensions are added since you are just adding more orthogonal normal distributions. However, the prediction points vary along a chi-squared distribution which skews higher the more dimensions are added. Since this is an unstructured model, it will always struggle in higher dimensions.
Average skewing higher with more dimensions

Math me again!! Let me see it up close...
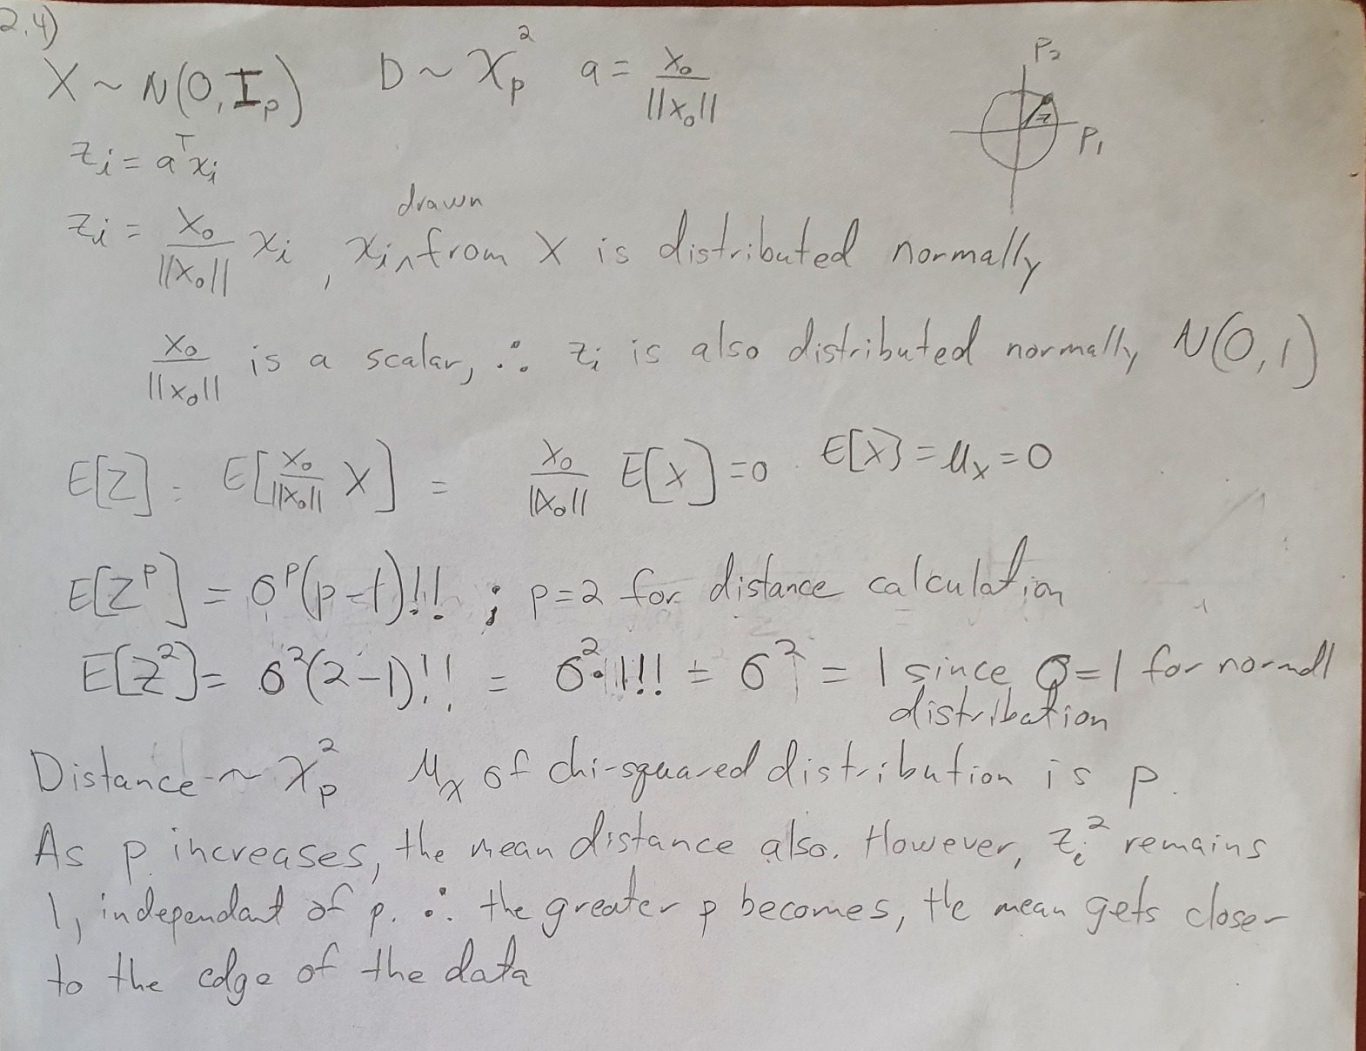
What does this mean? Well, you should just read it line for line. But, I'll give you the gist. The "Z" points are unit vector projections. The more dimensions you add, you also add more structure. You can see this using the formula for the expected value of Z^p. You can get this from wikipedia. This shows that when you are doing an L2 calculation (distance), use p = 2. You can see the expected value of Z^p remains at 1, even though more dimensions are being added. Conversely, the expected value of a chi-squared distribution skews right as p increases. The more dimensions you add the farther you get away from 1, and the worse your model's performance will be. The only way to overcome the curse is to add exponentially more data or add structure to your model.
Get it? Me neither. I actually think it's right, but I wrote this so long ago (maybe 2015) that I'm not totally sure what I meant. I think the confusing part is that I use p two different ways. Once for the L2 calculations, and a different p for the increasing dimensions. Think about it... I will too...
This is a pretty good illustration of why I got an incomplete in Stats315A. This is pretty much the first homework problem.
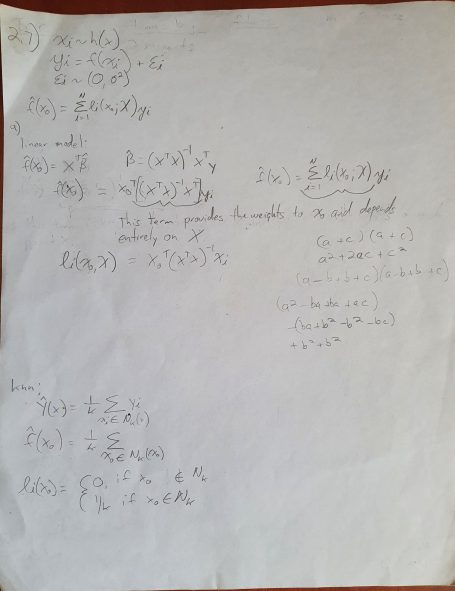
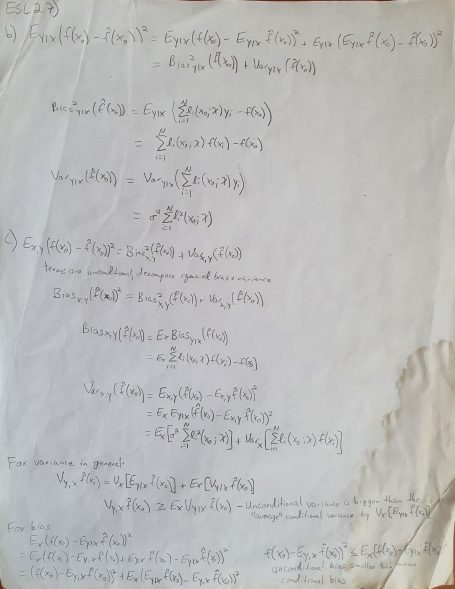
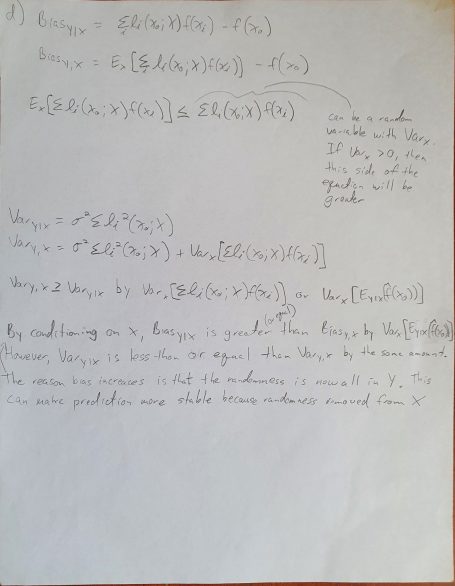
Lyx it!!

Bias-Variance tradeoff
Similar to the curse of high dimensions, the bias variance tradeoff is an important concept to understand mathematically. Here is a question from EOSL that does just that.

Why care about bias-variance tradeoff?
Because this is the key determination that should be made in statistical decision making. What you will find that it is generally easy to reduce one of the other, but very difficult to reduce both at the same time, which of course would be your goal if you want an accurate model.
What is bias? In statistical terms, it's how much the model is wrong on average. Variance is how consistently the model performs on repeated attempts. A zero bias model (such as a linear regression) might seem like a good idea, it usually isn't because overfitting leads to higher variance. Usually, the better approach is add a little bias for a reduction in variance.

Why should I care about ESOL 2.7?
Because it allows you to build a mathematical framework for the bias-variance tradeoff. Let's look at the question again. Part A asks to prove that both linear regressions and knn are both weighted estimators with the weights on each point dependant only on X. First of all, remember that all estimators are either linear regressions (max structure), knn (max flexibility) or a combination of the two. Part A of this question asks us to prove this.
There's more though. The rest of the question deals with error decomposition. Since error is a vector, it can always be decomposed into two orthogonal vectors. In this case, we need to decompose the error into bias and variance. You might already be familiar with linear regression decomposition where SST = SSR + SSE. SST is total error, where SSR is error due to variability while SSE is due to bias.
Finally, the question asks about the difference between conditional error and unconditional error. When you work through the math, you'll see that coniditonal on X increases bias, but decreases variance. So, either approach is valid, but one may give better results. Let MSE decide!!
Show me the math!!
We need your consent to load the translations
We use a third-party service to translate the website content that may collect data about your activity. Please review the details in the privacy policy and accept the service to view the translations.
